TNTU-Net: A Semantic Segmentation Model for Autonomous Driving
Project Motivation & Introduction
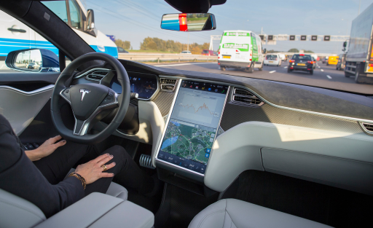
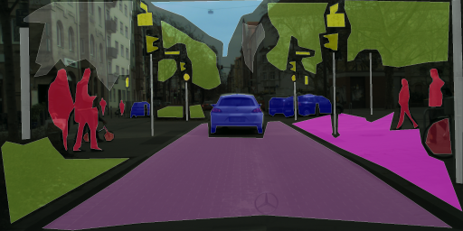
Nowadays, autonomous driving has become increasingly popular and applicable because of the rapid development of image sensing techniques and computer vision algorithms. Among the computer vision methods, semantic segmentation is rather important since it can help incorporate the inferred knowledge (such as the detected object) to enable the decision of autonomous driving. It refers to the process of classifying each pixel of an image into semantically similar labels.
In this project, we aim at the construction and evaluation of a semantic segmentation model based on Transformer-iN-Transformer (TNT) and U-Net. The proposed model leverages both the TNT and the U-Net structures to achieve a more precise localization as well as a better understanding of global information. In addition, different loss functions are considered in the model formulation to improve the classification performance as well as tackle the data imbalance issue.
Background
Semantic segmentation is an important research direction in the field of computer vision. Traditional machine learning and computer vision techniques have been utilized to address such problems in the past, but with the emergence of deep learning, especially Convolutional Neural Network (CNN), the accuracy and efficiency of the approach has increased exponentially. The fully convolutional network (FCN) with an encoder-decoder architecture has been the popular paradigm for semantic segmentation. However, one weakness of the pure convolution architecture is that the global context is unavoidably not well modeled.
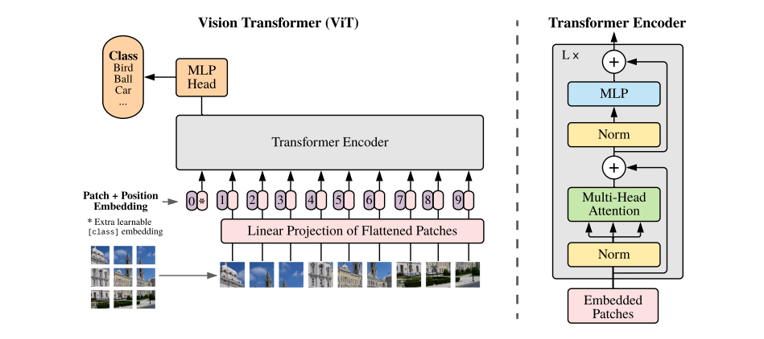
Recently, the new kind of neural architecture transformer [1], which can provide the relationships between different features based on self-attention mechanism, has been widely promoted as a powerful alternative for computer vision problems. Transformer-in-transformer, which is called TNT, is an evolution of transformer. Typically, TNT conducts the same process as transformer, but it does twice to get more powerful local features. Specifically, Han et. al proposed the Transformer-iN-Transformer network architecture which takes into account the attention inside the local patches of images and achieved better accuracy on the ImageNet benchmark [2].
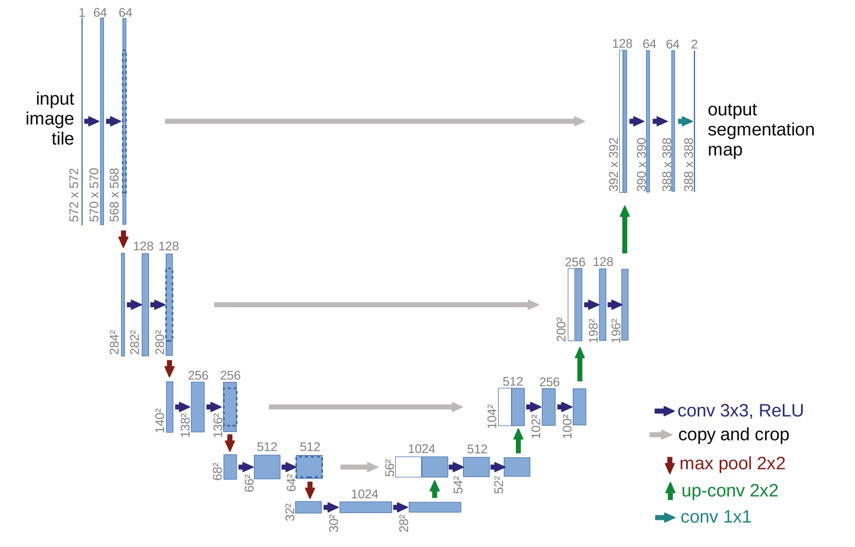
Besides, the U-Net architecture, which decodes that up-samples features using transposed convolution corresponding to each downsampling stage, presented a good performance for medical image segmentation tasks [3]. The symmetric expanding path uses CNN module and up convolutional module to do the upsampling until the features become almost the same size as the input. It is powerful to capture global context information.
Model Formulation
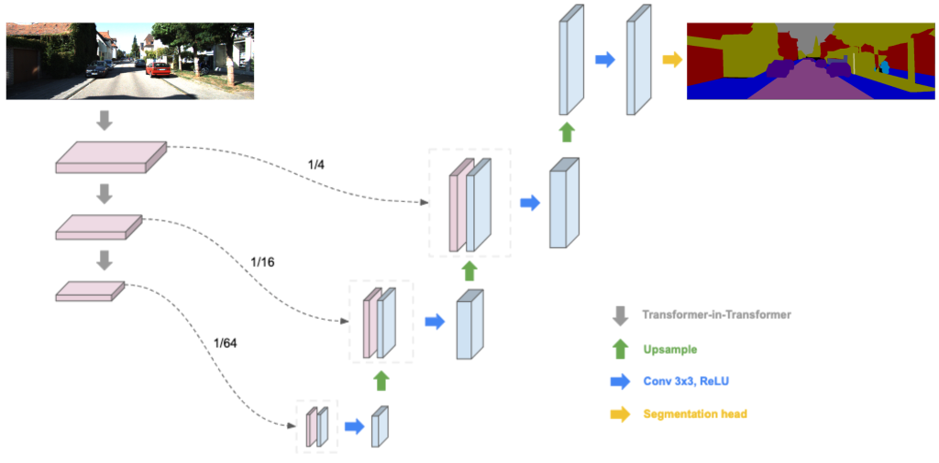
Because of the limitations of previous models, in this project, we propose a semantic Segmentation Model named TNTU-Net, which leverages the features of both TNT and U-Net. Specifically, we replace CNN module in the U-net by TNT module to create a new semantic segmentation structure. On the left side of the figure above, the gray arrow indicates the TNT module which is a feature extractor. The features on the left are copied to the right by using CNN module. Then the features are upsampled to the same size as the input.
Loss Functions
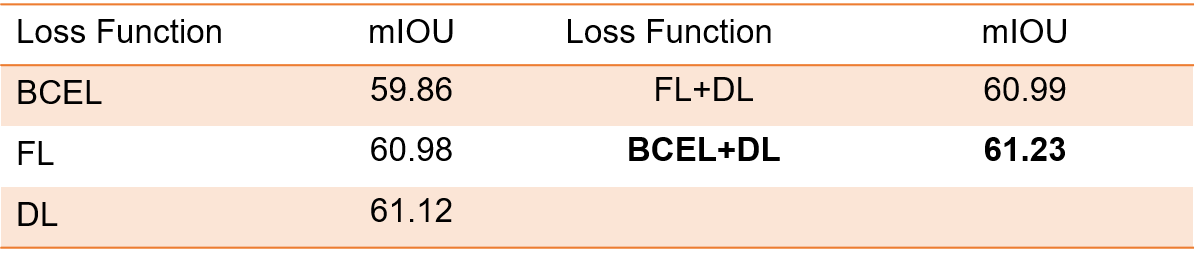
In this study, three types of loss functions are utilized to explore their influence on the model performance, i.e., binary cross entropy loss (BCEL) [4], focal loss (FL) [5] and dice loss (DL) [6]. They are commonly used in the semantic segmentation tasks. In addition, we tried the combinations of different loss functions. For example, the combination of focal loss and dice loss, the combination of binary cross entropy loss and dice loss, etc.
Dataset
The dataset we worked on is from KITTI, which is a semantic segmentation benchmark dataset [7]. It consists of 200 semantically annotated training as well as 200 testing images. And there are 11 categories/labels for the image, including building, tree, sky, car, sign, road, pedestrian, fence, pole, sidewalk, and bicyclist. Several experiments are implemented on this benchmark dataset to demonstrate the effectiveness of the proposed TNTU-Net architecture.
Model Evaluation
TNTU-Net Configuration for Training
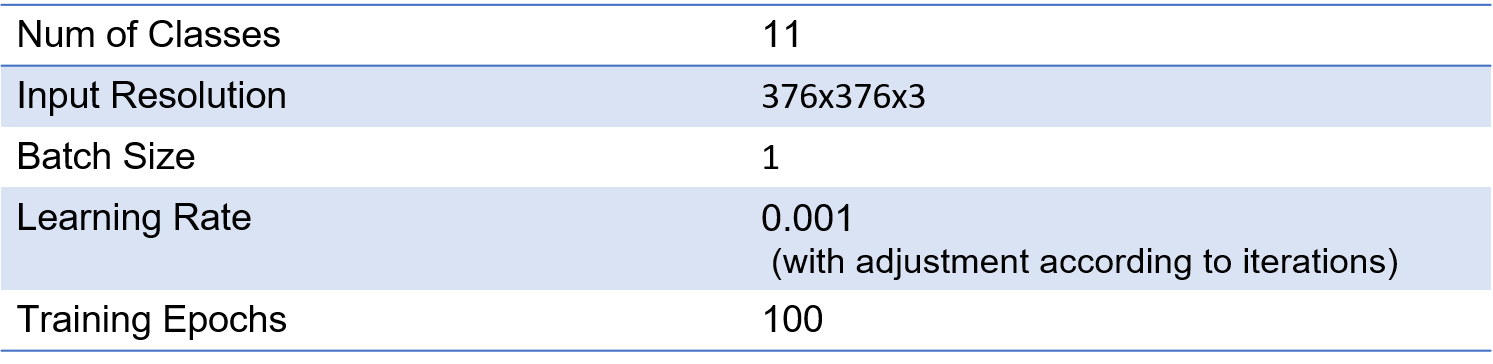
Evaluation Metric
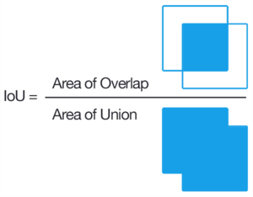
mIOU is a common evaluation metric for semantic image segmentation, which first computes the IOU for each semantic class and then computes the average over classes.
IOU = true_positive / (true_positive + false_positive + false_negative)
Evaluation Results
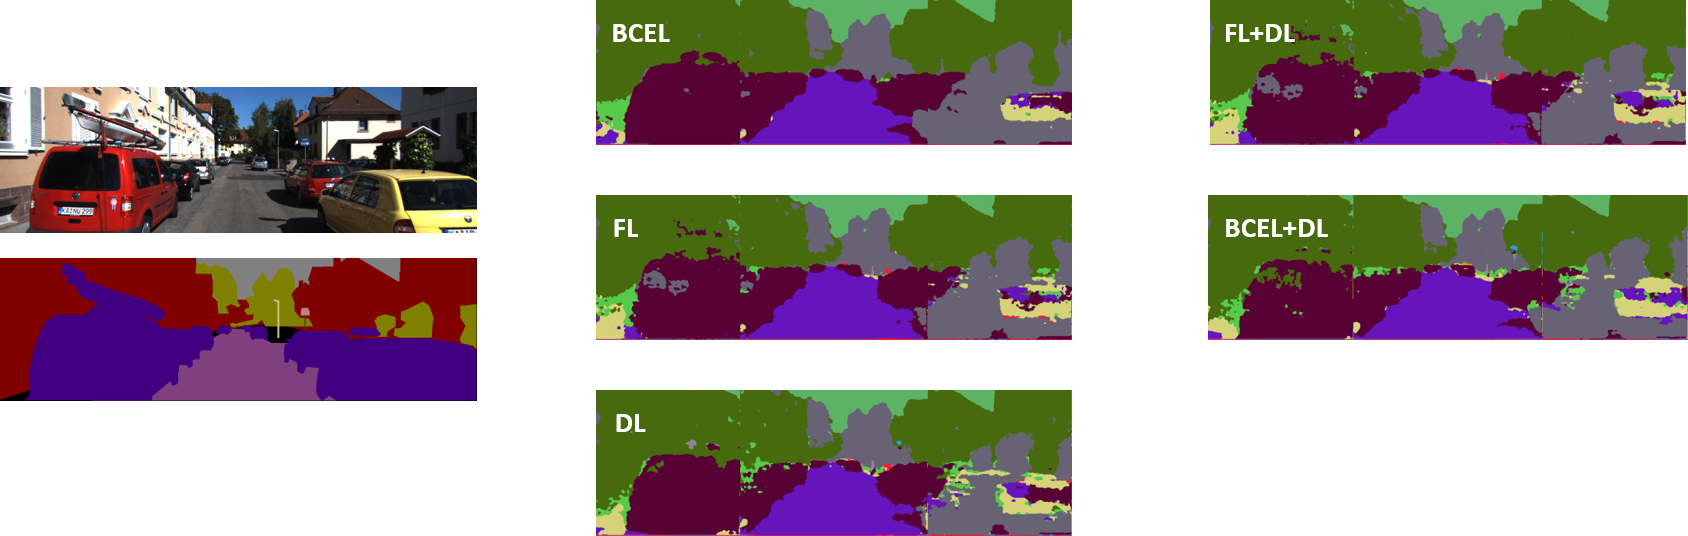
In the first step, the models are trained with BCE loss, Focal loss, and Dice Loss function, respectively. The results indicate that the model with dice loss has the best performance. Subsequently, we try to improve the model performance by using different combinations of loss functions. From the predicted segmentation results, we find that the predictions of the model with BCE loss function has less noises than the models with other functions. And the model with dice loss has the best performance so far. Thus, the combination of BCE loss function and dice loss is selected to train the final model. In the end, we get the best model performance with mean IOU of 61.23 from the final model.
Result Details of the Final Model
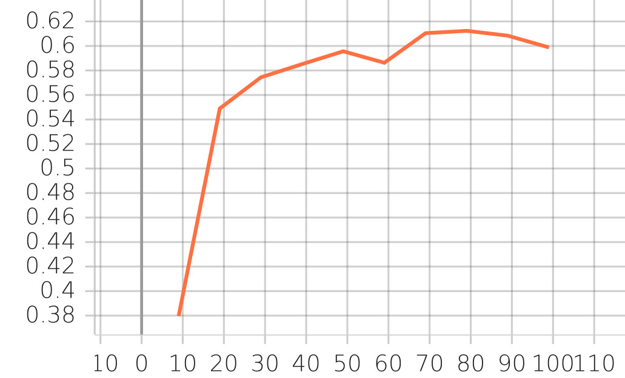
The following figures above show the prediction details of the final model.
The mean IOU curve:
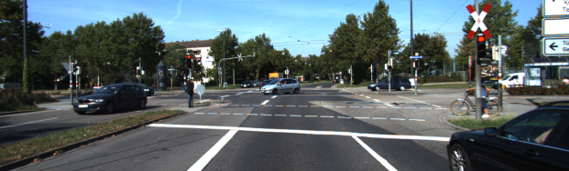
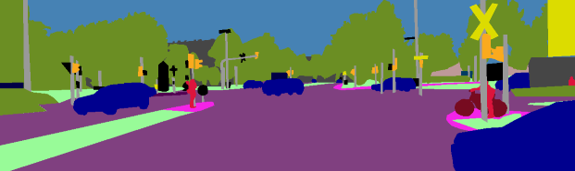
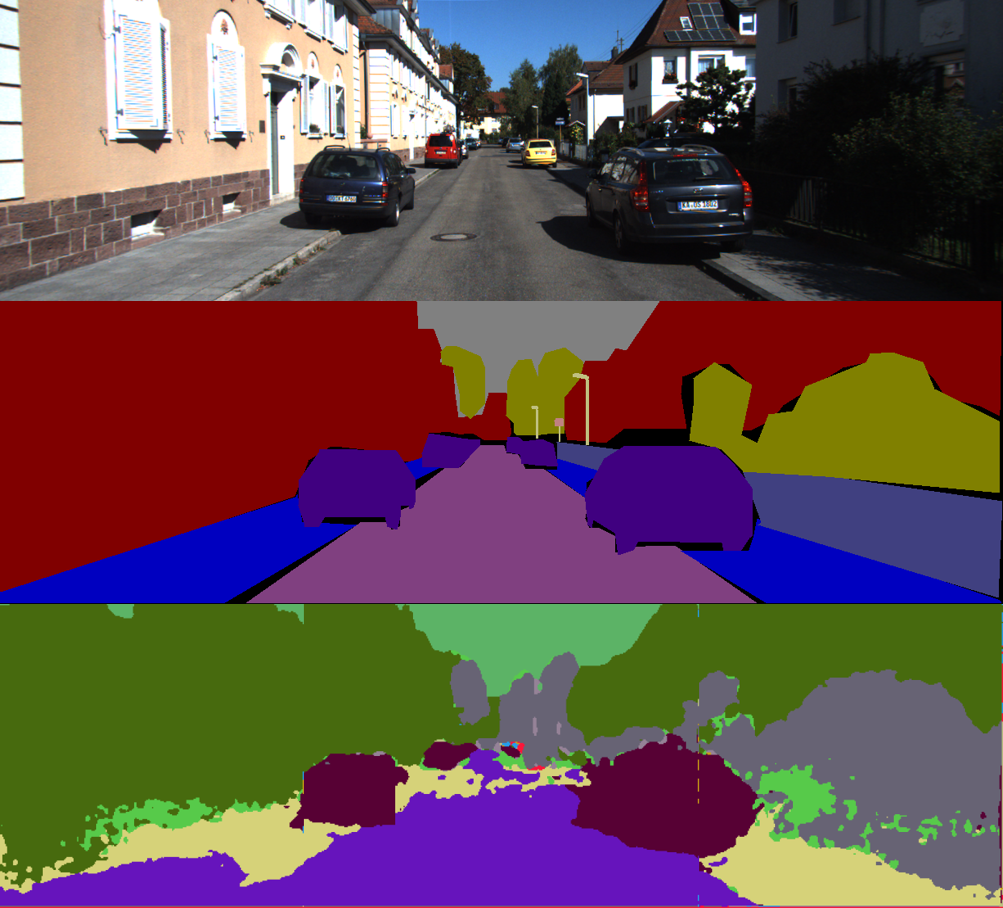
The segmentation results (raw, actual annotation, predicted annotation):
The confusion matrix of the classification results:
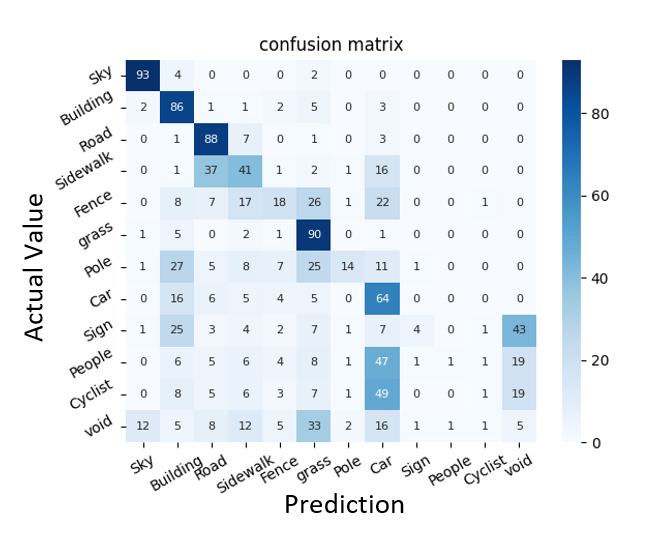
From the confusion matrix, it is noted that the proposed model mainly focuses on the big objects, such as the sky, building, road, sidewalk, grass, and car. And the performance of the model is not that good when it comes to small objects, such as the fence, pole, sign, people, and cyclist. This could be caused by the data imbalance issue. We further split the dataset into the big-object dataset and the small-object dataset and retrained the models, however, the improvement was not significant.
Discussion
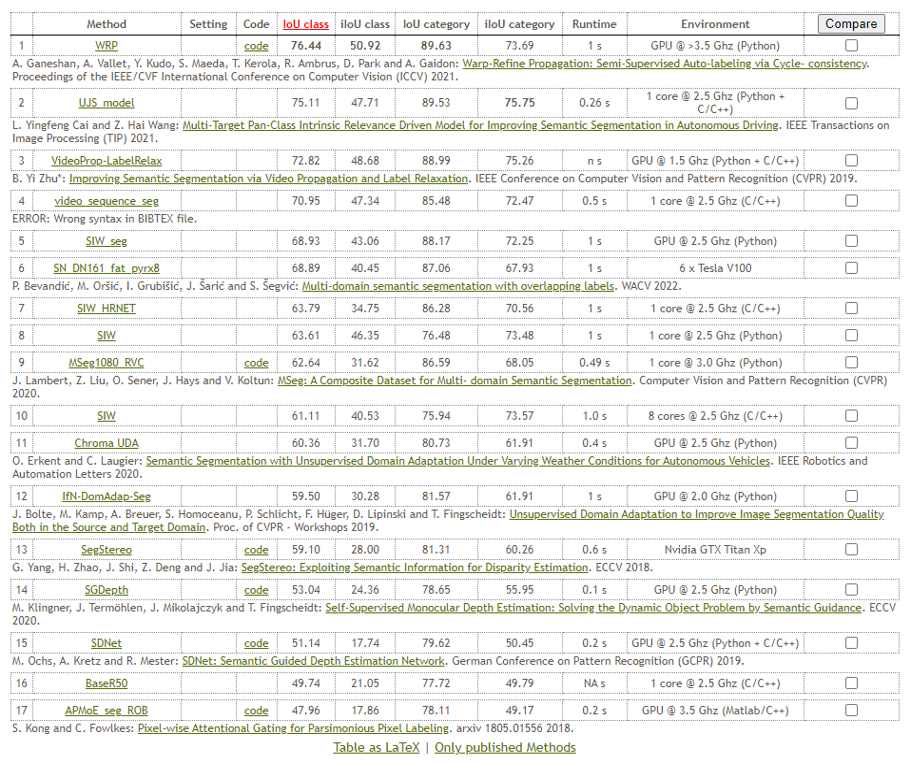
We also compare our results with the benchmark models on the leaderboard as shown above. The mean IOU of the first place is 76.44. and our is 61.23 which is the 10th place on the leaderboard. And we also trained the U-Net model as a baseline and the performance is 45.93.
After trying a lot of loss functions, We only slightly improve the model performance. Hence, in the future, we may need to further modify the model architecture to improve our performance. The most important thing that we learned in this project is how to build up a semantic segmentation model. This includes how to create a dataloader, how to build up the model architecture, and how to evaluate the model. Besides, we have done a lot of surveys on different loss functions. We not only understand the advantages of each loss function, but also conduct experiments to really observe the outcomes.
Demo
Here is a demo video that shows the semantic segmentation results in real-time.
Project Proposal
Midterm Report
Project Code Repo
Project Timeline
| When | Task |
|---|---|
| Feb 24 | Project Proposal |
| Feb 25 - Mar 20 | Proposed model construction and evaluation |
| Mar 20 - Apr 4 | Model improvement considering data imbalance issue |
| Apr 5 | Project mid-term report |
| Apr 5 - Apr 22 | Model fine-tuning and evaluation. Comparison with benchmark models |
| Apr 22 - May 5 | Final write-up, presentation preparation, website construction |
Reference
[1] Dosovitskiy, A., Beyer, L., Kolesnikov, A., Weissenborn, D., Zhai, X., Unterthiner, T., … & Houlsby, N. (2020). An image is worth 16x16 words: Transformers for image recognition at scale. arXiv preprint arXiv:2010.11929.
[2] Han, K., Xiao, A., Wu, E., Guo, J., Xu, C., & Wang, Y. (2021). Transformer in transformer. Advances in Neural Information Processing Systems, 34.
[3] Ronneberger, O., Fischer, P., & Brox, T. (2015, October). U-net: Convolutional networks for biomedical image segmentation. In International Conference on Medical image computing and computer-assisted intervention (pp. 234-241). Springer, Cham.
[4] Murphy, K. P. (2012). Machine learning: a probabilistic perspective. MIT press.
[5] Dice, L. R. (1945). Measures of the amount of ecologic association between species. Ecology, 26(3), 297-302.
[6] Lin, T. Y., Goyal, P., Girshick, R., He, K., & Dollár, P. (2017). Focal loss for dense object detection. In Proceedings of the IEEE international conference on computer vision (pp. 2980-2988).
[7] Abu Alhaija, H., Mustikovela, S. K., Mescheder, L., Geiger, A., & Rother, C. (2018). Augmented reality meets computer vision: Efficient data generation for urban driving scenes. International Journal of Computer Vision, 126(9), 961-972.